A Summary of and My Thoughts on the DocWrangler Paper
Background
I’ll summarize the main points from the “Steering Semantic Data Processing with DocWrangler” paper by Shreya Shankar et al and share my commentary (something I’ve been doing more of lately).
This work is inspiring and fascinating. Shreya previewed DocWrangler during the AI Evals course, but reading the paper—especially the user study section—helped me grasp its magnitude. While I lack formal data visualization training, what I’ve read (like Visualization Analysis & Design by Tamara Munzner) taught me about the fundamental building blocks of data, UI, analysis goals, and their relationships. For example:
Search can be classified according to whether the identity and location of targets are known or not
- both are known with lookup
- the target is known but its location is not for locate
- the location is known but the target is not for browse
- neither the target nor the location are known for explore
or:
The intent of the user is to generate new material.
There are three kinds of produce goals:
- annotate (adds a new attribute to the data)
- record (saves visualization artifacts as persistent artifacts)
- derive (produce new data elements based on existing data elements)
Reading the DocWrangler paper felt similar—like discovering building blocks of a fundamentally new paradigm. LLMs enabling large-scale data analysis is already paradigm-shifting, so our analysis methods should match that novelty. Exciting time to work with data!
I’m trying out collapsible sections for paper quotes so that it shortens the blog post.
Abstract
…building effective semantic data processing pipelines presents a departure from traditional data pipelines: users need to understand their data to write effective pipelines, yet they need to construct pipelines to extract the data necessary for that understanding…
With structured data, you have deterministic algorithms (groupby, aggregate, filter) available through stable APIs like Pandas. With unstructured data and LLMs, no stable API exists. Anthropic doesn’t have a reference page for semantic data processing—just guidelines on structuring prompts. These guidelines may or may not work depending on your model, task, and data. Success requires iteration: prompt → inspect results → improve prompt. Each pipeline step affects the next, accumulating ambiguity throughout.
Large collections of unstructured text (emails, documents, reports, transcripts) contain variations of similar data. An email thread about a project might refer to tasks using different words and phrases. Company reports express sentiment differently across documents. Compare this to a 5-point Likert scale from a survey. Before identifying characteristics in unstructured data, you must interpret how different variations of the same characteristic are expressed. This requires processing lots of information—where LLMs excel. But determining which concrete steps, in which order, with which prompts requires going back and forth between understanding your data and constructing/improving your pipeline.
Fellow fast.ai students will recognize this philosophy: you often need a quick and dirty model to view actual vs. predicted results before identifying what needs data cleaning.
…[DocWrangler is] a mixed-initiative integrated development environment (IDE) for semantic data processing…
It’s important to highlight the difference between DocWrangler and DocETL. DocWrangler is the graphical user interface where Shreya and her team have designed intentionally a specific set of interaction components to construct semantic data processing pipelines. It is an opinionated frontend with specific goals. DocETL is the back-end which runs the pipeline as defined by a YAML file. In theory, you can write whatever front-end you want on top of DocETL.
Introduction
semantic data processing: a paradigm where users can instruct LLMs to manipulate data through familiar data processing operators like map, reduce, filter, and groupby.
Even though LLMs don’t have a deterministic, stable API to perform common algorithms, we can still use them for that end. Say we have a collection of 10,000 documents, we can use a semantic map “to extract mentions of medications and reported side effects, followed by a semantic reduce to summarize effects per medication.”
gulf of comprehension: Documents contain too much information for humans to fully process [and for LLMs to accurately process].
gulf of specification: users must first discover their true intent—often only possible after exploring sufficient data to understand what questions the data can reasonably answer.
gulf of generalization: even with clear, unambiguous prompts, LLMs may fail to generalize correctly to the user’s actual data
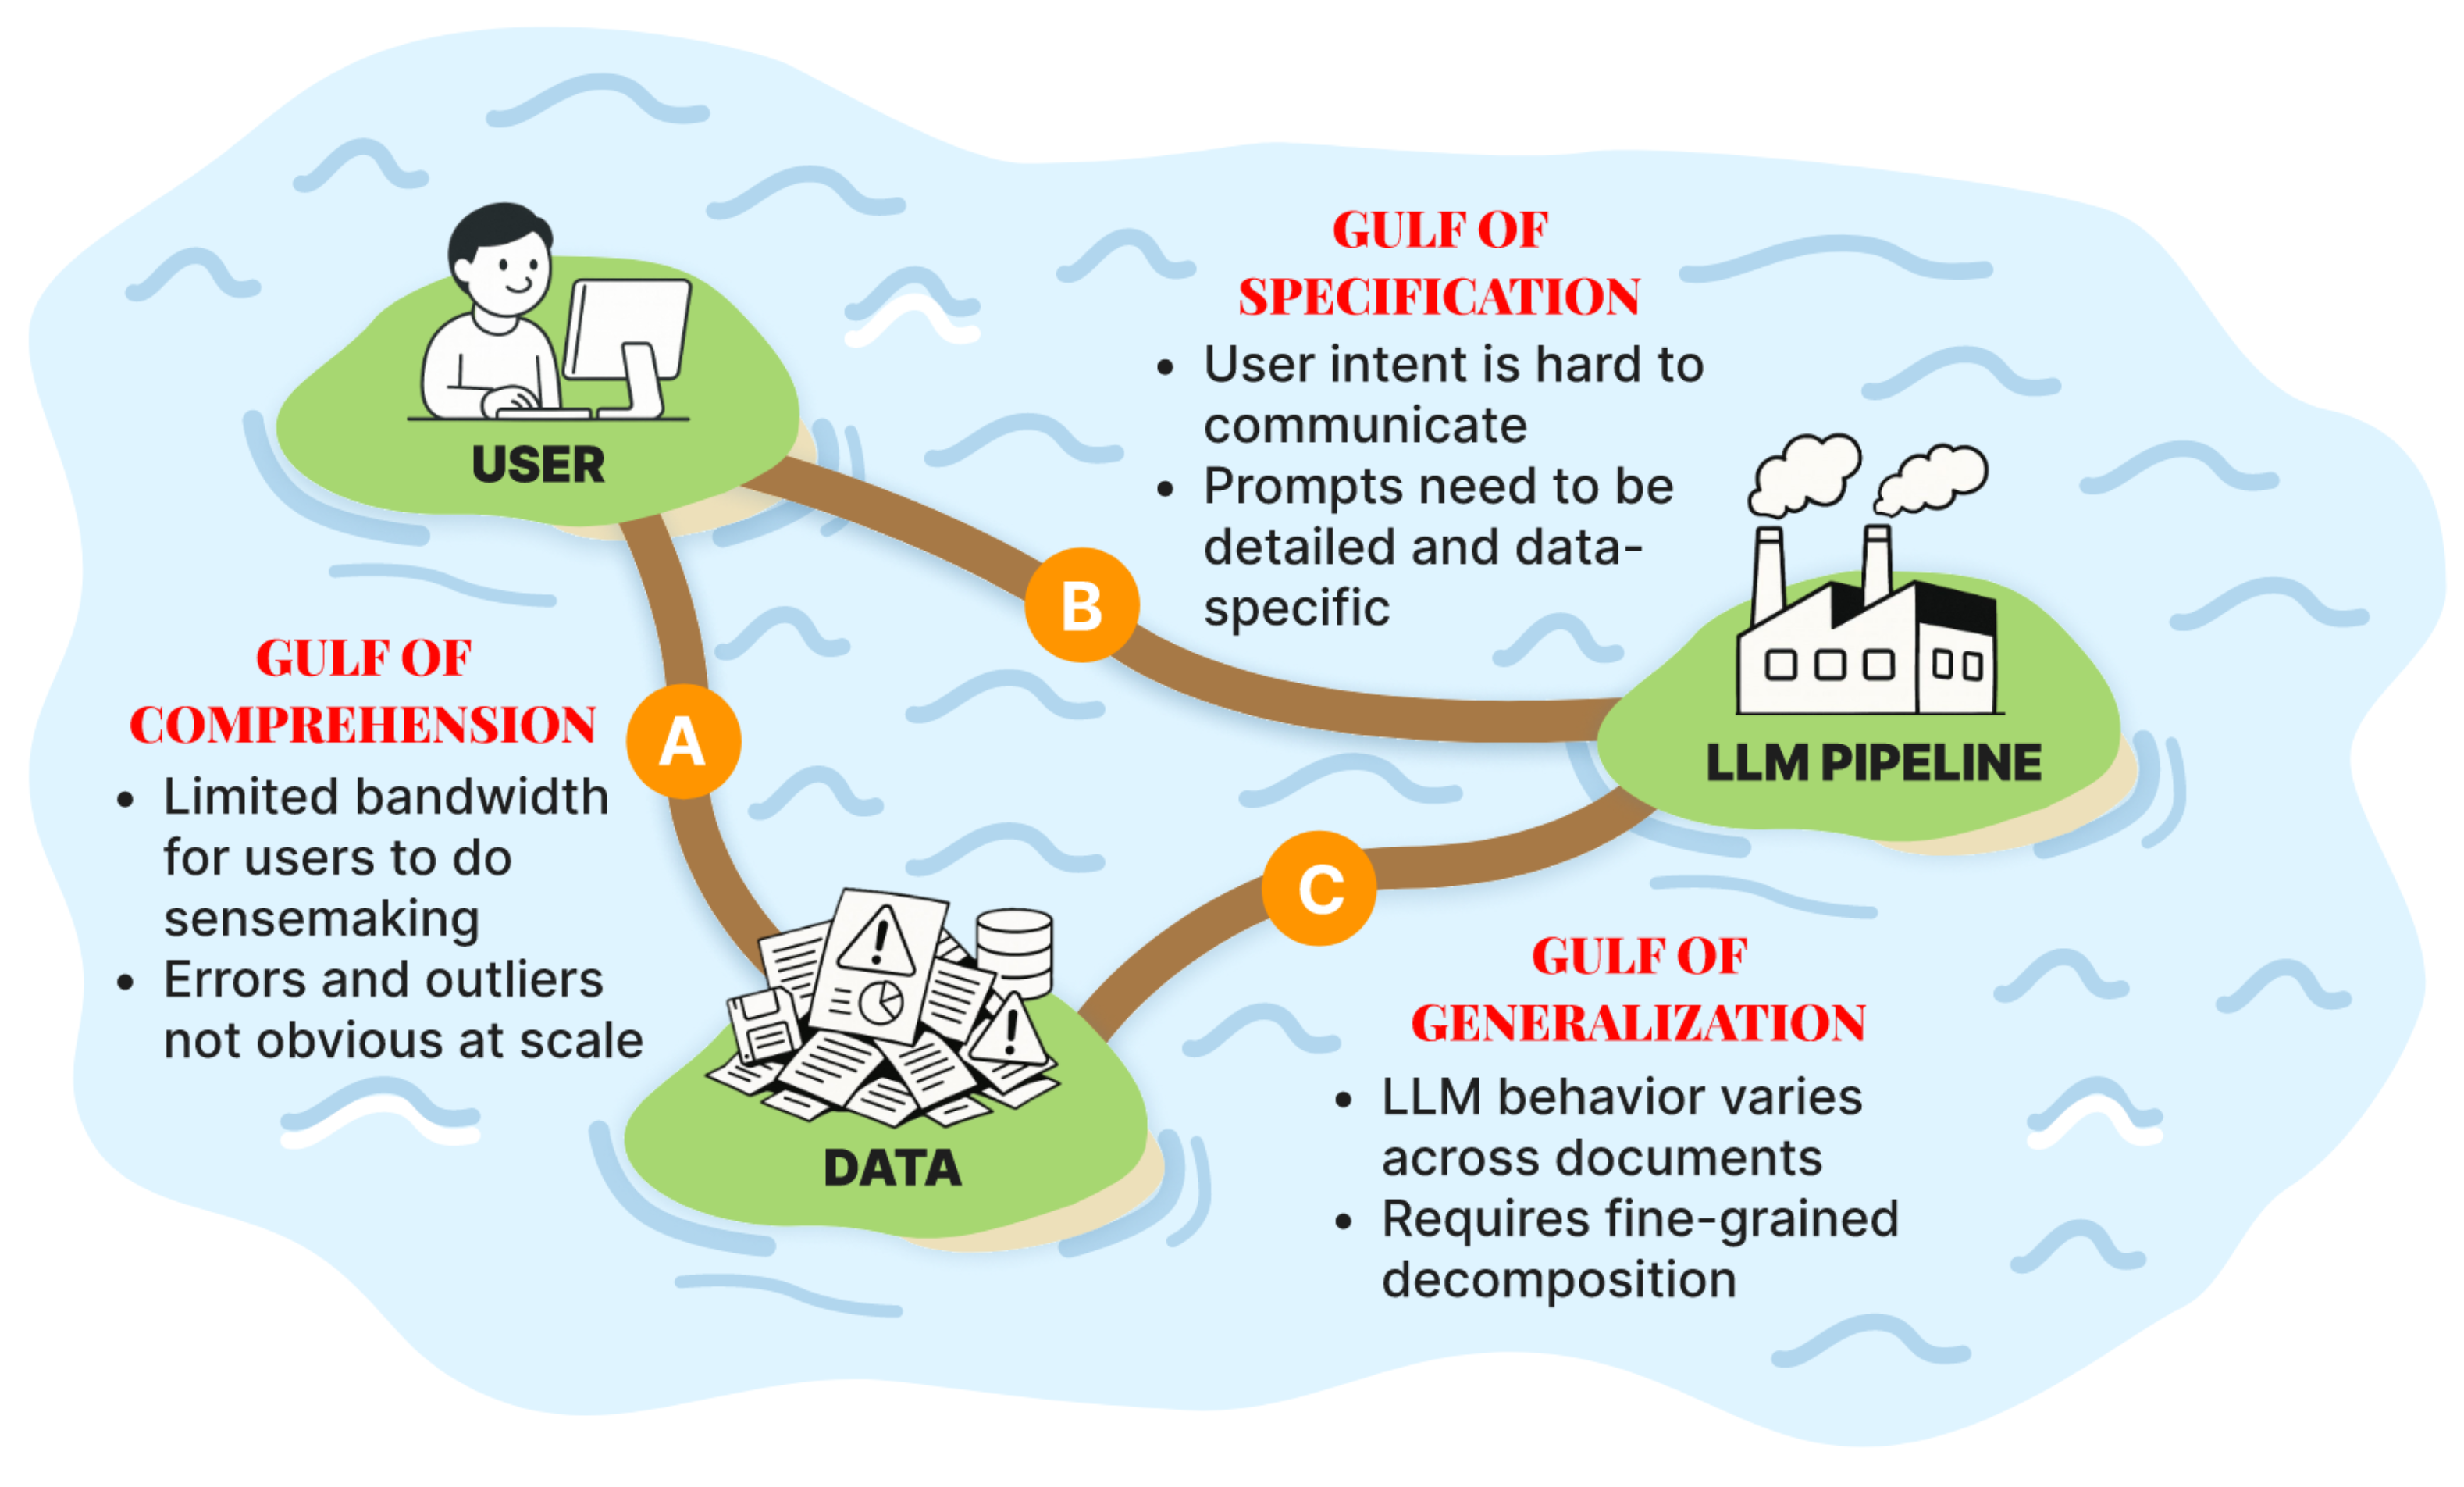
The Three Gulfs Framework drives DocWrangler’s design philosophy. The comprehension gulf motivates using LLMs, but LLMs aren’t a silver bullet. The specification gulf connects to the LLM paradox—deciding whether to apply semantic map or reduce requires knowing your data’s contents. In medical notes, some contain brand names, others generic names, others medication classes. You need to run map operations and examine samples to identify these patterns before crafting your final prompt and pipeline. The generalization gulf highlights LLMs’ fundamental limitation: they struggle with out-of-domain data.
The in-situ user notes feature tackles the comprehension gulf by enabling users to annotate observations directly on both documents and outputs. The LLM-assisted prompt refinement feature addresses the specification gulf through an interactive interface where an LLM analyzes the pipeline, documents, outputs, and user notes to suggest more effective prompts. The LLM-assisted operation decomposition feature targets the generalization gulf by identifying when the pipeline is inadequate for the documents, using an LLM-as-judge that runs in the background.
In-situ user notes attach as text attributes to specific data items, providing context when the LLM helps refine prompts or suggest task decomposition. I think the quality of in-situ user notes drives the entire effort to bridge the three gulfs.
Users also employed intentionally vague prompts in map operations to learn more about their data, reminiscent of epistemic actions, i.e., actions taken not to directly achieve a goal but to gather information that reveals new possibilities.
I want to highlight this because 1) this behavior stems from DocWrangler’s design, and 2) it demonstrates good problem-solving skills. I often run intermediate code while trying to understand relationships between high-level abstractions and low-level functionality in a codebase. Intentionally vague prompts expose the LLM’s and data’s “tells”—what does the LLM naturally parse from the data? What data characteristics work best with LLM processing? A common theme: the study users are smart, and DocWrangler facilitates smart decisions.
DocETL Background and Example
Each LLM-powered operator is defined through two components: a natural language prompt that specifies what the operation should do, and an output schema that determines the structure of data the LLM should generate.
Every experience I’ve had with structured data responses has been positive. I discovered this concept through FastHTML’s __ft__ method for dataclasses, then later through Anthropic’s XML response format documentation. Having an output schema makes you think about your needs—what data and data types fulfill them, and what format works for post-processing. In DocETL pipelines, the output schema determines the input schema for the next operation.
resolve Operator
resolve (performs entity resolution and canonicalization across documents).
Highlighting this operator because I was not familiar with the terms ‘entity resolution’ (figuring out when different text references actually refer to the same real-world thing) and ‘canonicalization’ (converting these different variations into one standard, consistent form). One example could be resolving different medication names, generic or brand name.
showing aggregates first helps users identify patterns, while enabling drill-down into specific examples supports verification
Quick aside: I generally dislike dashboards because they facilitate bloated data presentation. I’ve repeatedly seen people equate visualization quantity with quality—like showing you have data is itself a feat. Sometimes it is, especially when organizations try to change their data culture. But after seven years as a data analyst, I think 90% of data presentation only requires (and is most effective with) simple tables or bar plots. Start with high-level aggregate tables or bar plots, then drill down to lower-level categories as you scroll. chef’s kiss.
- D1. Scaffold Pipeline Initialization: Help users create and configure operations with minimal friction, with built-in guidance and quick experimentation.
- D2. Facilitate Efficient Data Inspection and Notetaking: Enable users to validate inputs and outputs individually and in aggregate, while supporting note-taking to capture insights and patterns.
- D3. Guide Pipeline Improvement: Offer assistance for translating user feedback into effective pipeline modifications, both at the individual operation level (e.g., prompt improvements) and pipeline level (e.g., operation decomposition).
- D4. Maintain End-to-End Observability: Ensure transparency into transformation logic at each pipeline step (e.g., inputs, outputs, LLM prompts).
- D5. Minimize Context Switching: Integrate all essential analytical capabilities within a unified interface, minimizing the need for external tools (e.g., spreadsheets, custom scripts, AI assistants like ChatGPT).
Combining the highlighted terms into a single phrase: the goal of Doc Wrangler is to operationalize semantic data processing with built-in data validation and annotation, LLM-assisted pipeline modification, and full pipeline transparency in a unified interface.
DocWrangler System
I’m planning on doing a video demo of DocWrangler so I won’t go into details about the interface from the paper. Instead, I will highlight a couple of aspects of operation decomposition which I think is the most interesting part of the system. Mainly because task decomposition is something that I’ve been thinking a lot about recently. On that note, here’s a tweet from Shreya that gives the best explanation and motivation for task decomposition that I’ve come across yet:
What struck us was that these weren’t prompt-engineering problems. They were structural decomposition problems. Every serious task required breaking down into sub-task, where, crucially, each sub-task is something that an LLM can reliably do. But even expert engineers couldn’t predict the right decomposition without long cycles of trial and error. This is what makes LLM pipelines different from SQL.
In a database, users declare what they want, and the optimizer finds a good plan. We can assume the query itself is correct. For LLMs, we can’t even write a pipeline that works “as is” on state-of-the-art models. So the optimizer must generate and test different pipelines on the user’s behalf. Optimizers need to test many different logical rewrites of the initial pipeline to see what will work best.
While they are inspecting symptom outputs, DocWrangler notifies the user (Fig. 6A) that the operation may be too complex (D3). Clicking on the notification triggers the the Operation Decomposition feature. A dialog appears, showing examples of incorrect LLM results when handling both discomfort assessment and symptom extraction simultaneously (Fig. 6B). The analyst clicks “Automatically Decompose” (Fig. 6C), and the system transparently streams its accuracy optimization process (Fig. 6D), evaluating different candidate plans with LLM-as-judge evaluators [105] (D4).
I like how data validation is built into the operation decomposition feature. The LLM presents evidence for why it thinks the task should be decomposed. The accuracy optimization process involves different candidate paths evaluated by an LLM judge, which is a really interesting way to use LLMs for pipeline optimization.
For each document, we remove text from the middle while preserving beginnings and endings, replacing the removed content with an ellipsis. Essentially, as the conversation history grows, documents progressively lose more middle content to accommodate new messages within the context window. We specifically preserve document beginnings and endings because introductions typically contain key metadata and conclusions often summarize content, both important for maintaining document context for the LLM.
This made me think about human document design. From elementary school, we learn to structure papers with introduction, thesis, body paragraphs (one per supporting point), and conclusion. We’ve collectively standardized information structure, even in unstructured formats. This enables clever removal of likely low-importance content to fit context windows.
User Study Findings
This is my favorite section of the paper, and I’m excited to share what I found particularly informative and interesting.
even five participants can uncover valuable usability insights
I didn’t know research showed you only need 5 participants for valuable usability insights. Makes sense though—in my 3-5 person teams, getting their feedback on reports or data products significantly improves the output. This 5-person threshold makes UX research accessible for bootstrapped teams.
To better understand LLM behavior at a glance, participants often adjusted operation outputs for interpretability…these added attributes (e.g., rationales, summaries, indicators) were not used as final task outputs. Instead, they served to help participants verify whether the LLM had correctly interpreted their intent—bridging the specification gulf.
Returning to the LLM paradox: users cleverly augmented LLM outputs with interpretability clues to better understand how the LLM handles tasks, enabling better decisions about improving prompts or decomposing operations. This interpretability output also informs the LLM during prompt refinement or operation decomposition assistance. This exemplifies the stability-capability tradeoff I mentioned—sure, it takes fuzzy, squishy data processing to understand LLM behavior, but that fuzziness provides information richness you can’t get with structured data.
when analyzing doctor-patient trust, P1 initially used a free-form trust_summary attribute, but added a boolean trust attribute to validate results more easily via a histogram. As shown in Fig. 8, the LLM labeled all examples as “true,” so P1 switched to a 5-point Likert scale for more granularity
I’m always interested in effective Likert scale use (usually find them ineffective) and examples of binary classification (easier for LLMs). This excerpt highlights both. The trust_summary became a boolean trust attribute, which when all labeled “true” led to a 5-point Likert scale revealing proper trust distribution. Another example where structured data from a survey’s true/false trust question couldn’t tease out the nuance you get by transforming unstructured trust summaries into Likert scales with an LLM.
Unlike typical data science workflows where users begin with exploratory data analysis [57], all participants skipped manual document review and jumped straight into writing map operations. As they inspected outputs, they frequently revised their pipelines in response to what they saw—what we call opportunistic realignment.
This reminds me of fast.ai’s approach. When confronting a problem, train models first and examine results—baseline heuristic, then traditional ML, then neural nets. Some upfront cleaning and quick viz helps, but much data intuition comes from training models and examining results. As Jeremy Howard shows in his Paddy Doctor Kaggle series, get through your entire pipeline first, then change one thing at a time following intuition rather than running hyperparameter sweeps. You need fast, tight feedback loops—manual document review prohibits this. Makes sense users jump straight to operations. I’ll remember this when using DocWrangler.
even though the Operation Decomposition feature was designed to help address the generalization gulf, users sometimes adopted it as a way to improve specification too—using suggestions to rethink how they framed their tasks or restructure their prompts.
When tackling LLM-assisted problems, you may not know what tasks are involved or their order. Makes sense that complex task decomposition informs users’ overall approach. Another example of how “The LLM Paradox” creates new problem-solving opportunities.
Some users shifted direction after spotting surprising or useful patterns in the LLM’s outputs. These “serendipitous” findings weren’t requested explicitly, but appeared occasionally, revealing new opportunities for analysis.
This resembles exploring structured data through different groupbys and aggregations—unexpected insights surface in visualizations. But there’s a fundamental difference. With structured data, you can list all columns and explore methodically. With unstructured data at scale, you may not know what information is buried in documents. These “new opportunities” involve LLMs discovering previously unknown data attributes.
“prompt rubber ducking”: how interacting with LLMs helped them figure out what questions to ask about their data. In this way, semantic data processing pipelines don’t just answer predefined questions, they also help shape users’ understanding of what questions are worth asking—perhaps similar to the “berry picking” model of information seeking, where users iteratively refine their search as they gain new insights
The “berry picking” model definition:
Bates, 1989 proposed the berry-picking model of information seeking, which has two main points. The first is that, in the process of reading and learning from the information encountered throughout the search process, the searchers’ information needs, and consequently their queries, continually shift (see Figure 3.3). Information encountered at one point in a search may lead in a new, unanticipated direction. The original goal may become partly fulfilled, thus lowering the priority of one goal in favor of another. The second point is that searchers’ information needs are not satisfied by a single, final retrieved set of documents, but rather by a series of selections and bits of information found along the way. This is in contrast to the assumption that the main goal of the search process is to hone down the set of retrieved documents into a perfect match of the original information need. (source)
This model matches anyone’s Google or Wikipedia journey—you start with one page, encounter new terms, look those up, find related concepts, look those up, step back, move forward. Non-linear information seeking. This matches the earlier user behavior where users skip manual document review and jump straight into map operations to discover patterns. Semantic data processing is like LLMs going on their own Google/Wikipedia journey.
system responsiveness allowed rapid iteration…output schemas acted as “speed breaks”, slowing exploration just enough for meaningful reflection
This testifies to DocWrangler’s UI design. One reason vibe coding fails is that chatbot interfaces lack user interaction elements that switch between rapid iteration and meaningful reflection. Problem-solving (Polya’s method) involves: understanding the problem, breaking it into steps, generating a plan, and working iteratively in small chunks. While users could follow this method themselves, having a UI that conduces this organically is impressive.
A key factor in whether participants accepted [LLM] suggestions was their confidence in implementing the changes on their own.
LLM users relate to situations where LLMs suggest commands or functions outside their understanding. I’ll often trust the LLM if the code works—especially for bash commands. But if suggested code is fundamental to my script and in Python, I’ll understand each line and likely implement from scratch.
LLM pipelines blur the boundary between data cleaning and analysis, unlike traditional workflows where these phases are less intertwined
Users requested LLM error tracing features. In one example, a user wanted to identify where dosage was incorrectly listed as 200 grams instead of 200 milligrams. The LLM faithfully reproduced this error without understanding 200 grams is incorrect. This emphasizes the need for domain experts reviewing LLM inputs/outputs and the importance of citations now common in frontier model interfaces—though citations don’t guarantee correct LLM interpretation.
Real-World Deployment and Usage
In addition to their 10 Think-A-Loud interview sessions with participants in the user study, the authors also deployed DocWrangler online and collected telemetry data for about 1500 interactions (pipelines). This section details some of the interesting findings.
users often struggle with formulating effective prompts from the outset.
There was evidence that users needed the prompt confinement LLM assistance to improve their initial prompts, which were often ineffective. This highlights the importance of prompt engineering as a skill but also provides evidence that the DocWrangler interface was designed correctly.
53% of pipelines grew more complex by adding operations or upgrading models; 18% actually became simpler through operation consolidation or reduced sample sizes; and 29% maintained the same operations while only changing prompts or output schemas
I’d like to understand which tasks led to complexity growth versus simplification. Did complexity grow because humans better understood workflows by breaking tasks into sub-tasks, or because they had to adjust to LLM limitations? I’m confused why “upgrading models” counts as complexity growth.
Discussion
We observed users creating what creativity support tool (CST) research calls epistemic artifacts [89]—exploratory objects that help users discover possibilities…any system addressing ambiguous tasks may benefit from CST design principles; e.g., supporting exploration without predefined goals and allowing movement between different levels of abstraction
I love epistemic artifacts—one reason I love notebooks. Notebooks let you quickly probe variables and data structures, visualizing them, wrapping them in functions, adjusting code on-the-fly in a unified interface. It’s why chatbot interfaces resemble notebooks and why AnswerAI’s SolveIt platform works (combining LLM interaction with editable notebooks).
“Addressing ambiguous tasks” is core to problem-solving. Makes sense that DocWrangler’s interface—allowing data “exploration without predefined goals” and movement “between different levels of abstraction”—is such an effective problem-solving tool for study users.
Final Thoughts
Few papers light up different parts of my brain—connecting past experiences with unconsidered opportunities, intertwining with my interests while providing chances to build new skills. The ColBERT papers, TinyStories, and Small-scale Proxies are examples. DocWrangler fits this mold. I feel introduced to a fundamental interaction pattern beyond generic chatbot interfaces. I’m excited to try DocWrangler with familiar data and record findings in future blog posts or videos. Thanks for sticking around until the end!