Causality, Time, and Empiricism
One topic I’ve been fascinated about is the relationship between causality and time. I’ve had a multiple hours of conversations with Claude over the past year on this topic, helping me find existing literature that either supports or refutes my thinking. I’ll try to separate my thinking from Claude’s with blockquotes. I have also left footnotes at the bottom of this article for tangential thoughts that might distract the reader.
Causality and time seem inseparable. To ask why something happened, we need something to have happened, and “happened” implies that there was an initial state and final state, with time elapsed between.
Claude: [time] is a precondition for empirical knowledge itself. You can’t learn from experience without tracking state across time. Every experiment, every observation, every lesson is a before-and-after comparison.
This “triangle” of causality, time, and observation is of course a universal experience for all of us, but I’d wager that data scientists and machine learning engineers like myself spend a lot of time thinking about it (directly or indirectly).
Some excerpts from University of Pittsburgh’s archive on Hans Reichenbach’s work:
At first Reichenbach defines an ‘order’ of time, a ‘before-after’ relationship between mechanical events. In his later work, he comes to the conclusion that the ‘order’ of time needs to be distinguished from the ‘direction’ of time
Reichenbach claimed that in our world, there are a great many forks open to the future, but few or none open to the past. Moreover, he proposed that the direction from cause to effect could be grounded in this statistical asymmetry.
the modern theory of causal modeling does not use conjunctive forks to determine the direction of causation, but rather uses a probabilistic pattern that is essentially the exact opposite of a conjunctive fork. Thus Reichenbach was mistaken in looking to conjunctive forks to define the direction of causation. He would have done better to look to colliders.
While I don’t understand Reichenbach’s theory outside of those tl;dr excerpts, nor do I understand modern theory of causal modeling [1], Reichenbach’s comment that there’s no “fork” available to the past made me think of instrumentation and observability in ML/DS.
Imagine an ML pipeline. The input data is passed through a series of functions, each one transforming the data in its own way, all of it elapsing over time.

If we can take a snapshot of the data before and after every transformation, we can look at that data to understand if our system did what we expected and/or wanted in the past [2] [3]. These snapshots are tremendously useful when discussing with your teammates whether what’s happening should be happening and why.
Outside of ML pipelines, what allows us to discuss causality we observe as individuals? One answer is: the high speed of light in our universe.
What happens if we lived in a world where the speed of light was 10 mph? If I was stationary and my friend was running at me at 6 mph, would we agree on what we see? I prompted Claude this question and learned a lot of interesting things. The first being that there’s actually a book from 1965 where this is one of the story’s premises. (Mr Tompkins in Wonderland)
There is a metric called the Lorentz factor (γ = 1/√(1 − v²/c²); where c = speed of light and v = speed of an object) which determines how much length and time are affected when objects move at a significant fraction of c. Length contraction (1 / Lorentz factor) is the phenomenon that a moving object’s length is measured to be shorter than its proper length.
My friend moving at 6 mph in a universe where the speed of light is 10 mph would have a Lorentz factor of 1.25. 1/1.25 is 0.8 so from my friend’s perspective, objects (like me) would be perceived as 20% contracted in length.
There are a host of other phenomena that would happen:
- The Doppler effect would become perceptible, so objects would appear to be different colors whether you’re moving or not.
- Time would run slower the faster you move.
- Because of the Lorentz contraction, moving objects would appear rotated in image (Terrell rotation)
Thank goodness the speed of light is not 10 mph. This must mean that achieving consensus on “what are we looking at?” must be easy.
Unfortunately, anyone who has had an argument about “what happened?” knows this is not the case!
In a business most of our time is spent defining, calculating, analyzing and improving our understanding on three questions:
- What happened?
- Why did it happen?
- What should happen next?
Let’s look at the first question: What happened? Answering this question requires data collection which requires measurement.
Suppose you are trying to understand canopy coverage in a city. You decide to take videos and photographs using your own drones or existing satellite data.
What should you measure? There is nothing intrinsic about an object that “tells you” what to measure. You have to use some external-to-the-object instrument and apply some kind of mapping from object-space to number-space. I’ve usually seen two kinds of failures in mapping:
Suppose you want to count the number of trees, but because you only have an aerial view of the images with no other data like sonar, you don’t know if there are smaller trees blocked from view by larger trees above them. This leads to undercounting the number of trees. The mapping (3D object –> 2D image –> numbers) distorts reality.
Suppose that using the same data, one team defines “canopy coverage” by volume (by mutiplying the count by some average tree volume), another team defines canopy coverage by area (using object detection), and yet another team defines canopy coverage by the raw count. No one is wrong, but in the worst case, they all assume they’re defining the “canopy coverage” metric consistently. The mapping (3D object –> 2D image –> numbers) is interpreted incoherently.
And this is in a universe where the speed of light is fast enough that we don’t have to account for length contraction, time dilation or Doppler color shifts!
And while these anomalies don’t exist, we still need to (and should) account for each person’s perspective. If you talk to enough cross-functional SMEs on a project, you’ll realize that while each one sees something like this:
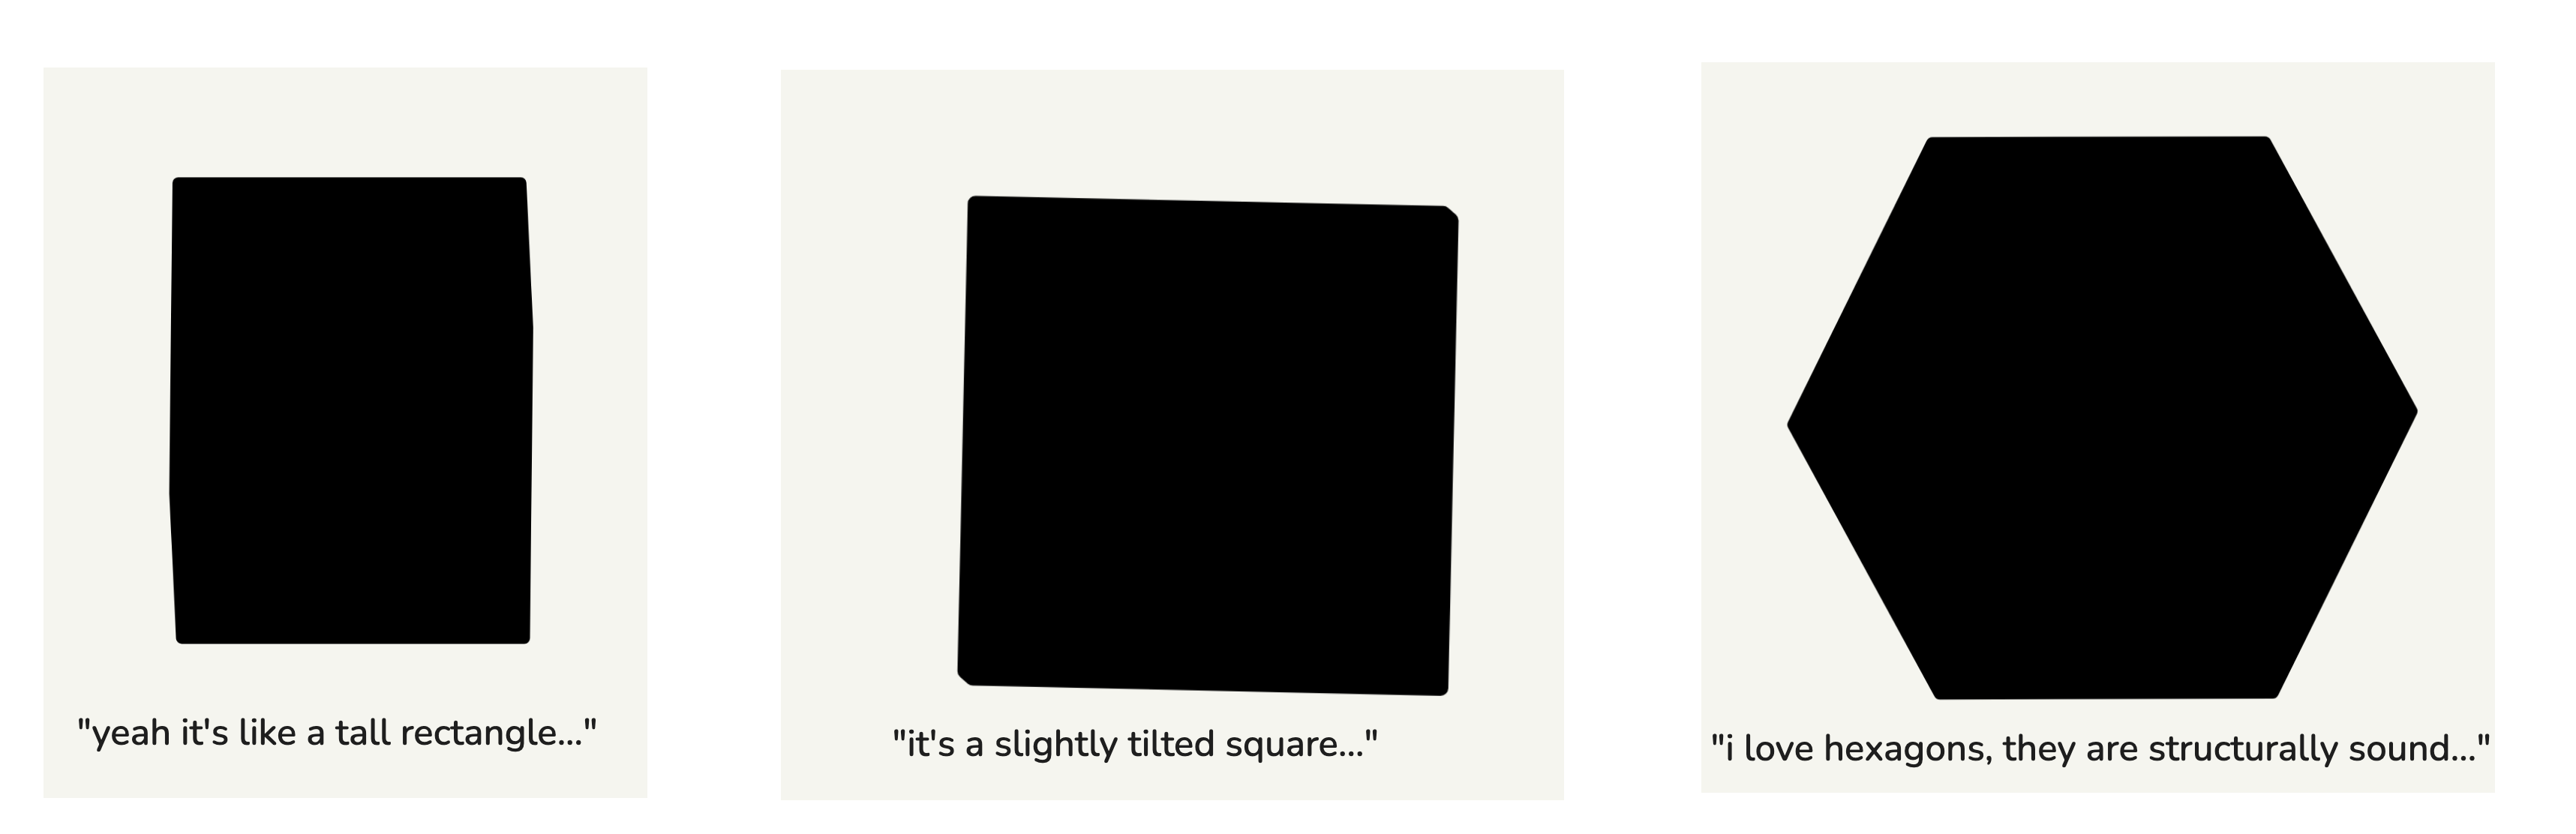
In a way, even with our very fast speed of light, we still end up experiencing length contraction, Doppler color shifts, and time dilation.
If you’re lucky, your synthesis and integration of all of these SME conversations will result in realizing that we’re talking about a cube!
One of the great joys of LLMs is exploring disparate and unfamiliar topics to a sufficient depth where you can grok concepts and apply them to your existing understanding of other topics. Improving my understanding of causality, time, empiricism, the relationship between them, and how to apply them to practical everyday tasks is lifelong work.
Footnotes:
[1] From a more(recent paper):
The above analysis shows that temporal and causal properties are strongly coupled with each other, and one cannot say which is logically (or ontologically) prior with respect to the other.
[2] This sort of “intermediate artifacts” instrumentation and observability has helped me understand the internals of the ColBERT and RAGatouille libraries.
[3] If you are using human-annotated data to train your model, observing how those annotations behave before and after transformations in a pipeline is a great way to test if your understanding of good and bad data quality is pragmatic.